!pip install matplotlib s3fs "xarray[io]"
import zarr
import numpy as np
import xarray as xr
import matplotlib.pyplot as plt
from matplotlib.colors import LogNorm
from scipy.signal import stft
Level 2 Data#
In this notebook we demonstrate the variety of different data available in the FAIR MAST dataset. In this example we are using level 2 MAST data, which includes cropping, interpolation, calibration, etc. of each signal, as well as mapping each diagnostic group try and follow IMAS naming convetions. The level 2 data is well-indexed data and follows the FAIR principles. Shots are also filtered using the plasma current to remove shots which were only used for testing, comissioning, machine calibration etc.
First we need to connect to the remote S3 storage bucket to access the data. Each shot from MAST is stored as a seperate Zarr file.
Using fsspec and xarray we can remotely read data directly over the web. In the example below we also turn on local file caching, allowing us to avoid reading over the network multiple times.
shot_id = 30421

endpoint_url = 'https://s3.echo.stfc.ac.uk'
url = f's3://mast/level2/shots/{shot_id}.zarr'

# Get a handle to the remote file
store = zarr.storage.FsspecStore.from_url(
    url,
    storage_options=dict(
        protocol='simplecache',
        target_protocol="s3",
        cache_storage='.cache',
        target_options=dict(
            anon=True, endpoint_url=endpoint_url, asynchronous=True
        )
    )
)
Summary Profiles#
The summary group provides a collection of general physics quantities for an experiment.
profiles = xr.open_zarr(store, group='summary')

plot_1d_profiles(profiles)
profiles
<xarray.Dataset> Size: 163kB
Dimensions:              (time: 2906)
Coordinates:
  * time                 (time) float64 23kB -0.0612 -0.06095 ... 0.6648 0.665
Data variables:
    greenwald_density    (time) float64 23kB ...
    ip                   (time) float64 23kB ...
    line_average_n_e     (time) float64 23kB ...
    neutron_rates_total  (time) float64 23kB ...
    power_nbi            (time) float64 23kB ...
    power_radiated       (time) float64 23kB ...
Attributes:
    description:
    imas:         summary
    label:        Plasma Current
    name:         summary
    uda_name:     AMC_PLASMA CURRENT
    units:        A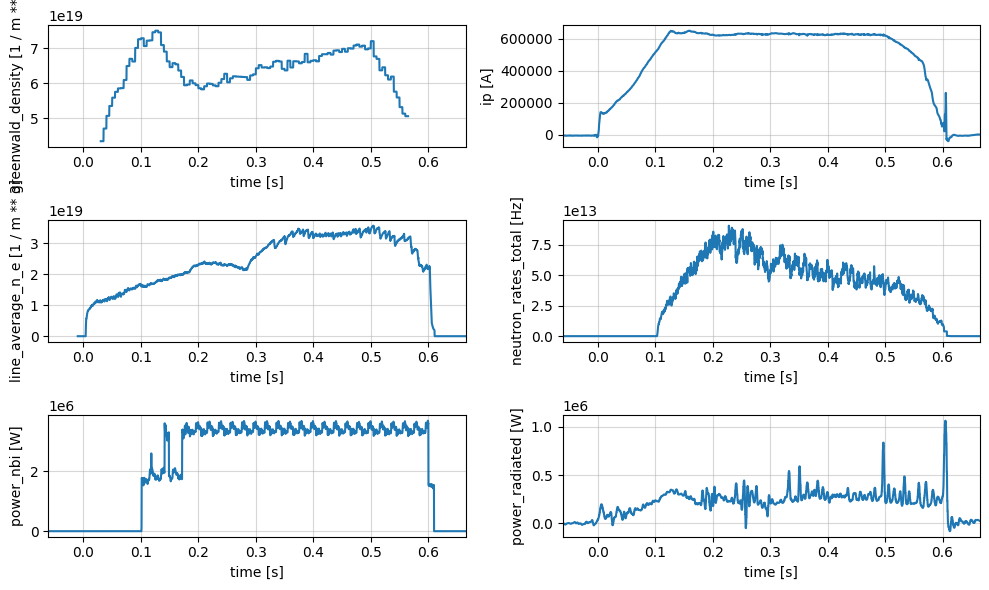
Pulse Schedule#
profiles = xr.open_zarr(store, group='pulse_schedule')

fig, axes = plt.subplots(2, 1, figsize=(10, 5))
axes = axes.flatten()
profiles['i_plasma'].plot(x='time', ax=axes[0])
profiles['n_e_line'].plot(x='time', ax=axes[1])


for ax in axes:
    ax.grid('on', alpha=0.5)
plt.tight_layout()

profiles
<xarray.Dataset> Size: 70kB
Dimensions:   (time: 2906)
Coordinates:
  * time      (time) float64 23kB -0.0612 -0.06095 -0.0607 ... 0.6648 0.665
Data variables:
    i_plasma  (time) float64 23kB ...
    n_e_line  (time) float64 23kB ...
Attributes:
    description:
    imas:         pulse_schedule
    label:        /xdc/ip/t/ipref
    name:         pulse_schedule
    uda_name:     /xdc/ip/t/ipref
    units:        A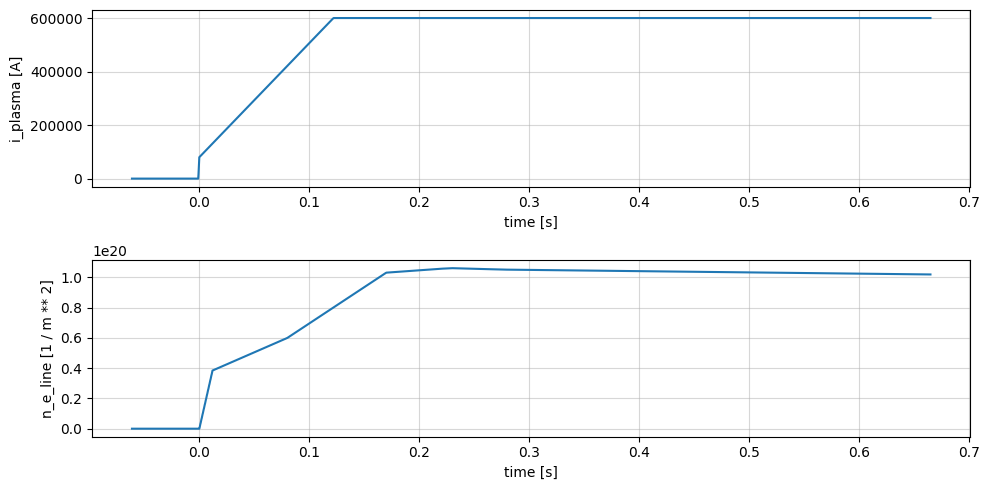
Magnetics#
Magnetic diagnostics for equilibrium identification and plasma shape control.
profiles = xr.open_zarr(store, group='magnetics')

fig, axes = plt.subplots(4, 3, figsize=(8, 10))
axes = axes.flatten()

profiles['b_field_pol_probe_ccbv_field'].plot.line(x='time', ax=axes[0], add_legend=False)
profiles['b_field_pol_probe_obv_field'].plot.line(x='time', ax=axes[1], add_legend=False)
profiles['b_field_pol_probe_obr_field'].plot.line(x='time', ax=axes[2], add_legend=False)


profiles['b_field_pol_probe_omv_voltage'].plot.line(x='time_mirnov', ax=axes[3], add_legend=False)
profiles['b_field_pol_probe_cc_field'].plot.line(x='time_mirnov', ax=axes[4], add_legend=False)
profiles['b_field_tor_probe_cc_field'].plot.line(x='time_mirnov', ax=axes[5], add_legend=False)

profiles['b_field_tor_probe_saddle_field'].plot.line(x='time_saddle', ax=axes[6], add_legend=False)
profiles['b_field_tor_probe_saddle_voltage'].plot.line(x='time_saddle', ax=axes[7], add_legend=False)
profiles['b_field_tor_probe_omaha_voltage'].plot.line(x='time_omaha', ax=axes[8], add_legend=False)

profiles['flux_loop_flux'].plot.line(x='time', ax=axes[9], add_legend=False)
profiles['ip'].plot.line(x='time', ax=axes[10], add_legend=False)

for ax in axes:
    ax.grid('on', alpha=0.5)
plt.tight_layout()

profiles
<xarray.Dataset> Size: 335MB
Dimensions:                                   (b_field_pol_probe_cc_channel: 5,
                                               time_mirnov: 363201,
                                               b_field_pol_probe_ccbv_channel: 40,
                                               time: 3633,
                                               b_field_pol_probe_obr_channel: 18,
                                               b_field_pol_probe_obv_channel: 18,
                                               ...
                                               b_field_tor_probe_omaha_channel: 4,
                                               time_omaha: 7264001,
                                               b_field_tor_probe_saddle_field_channel: 12,
                                               time_saddle: 36321,
                                               b_field_tor_probe_saddle_voltage_channel: 12,
                                               flux_loop_channel: 15)
Coordinates: (12/14)
  * b_field_pol_probe_cc_channel              (b_field_pol_probe_cc_channel) <U13 260B ...
  * b_field_pol_probe_ccbv_channel            (b_field_pol_probe_ccbv_channel) <U10 2kB ...
  * b_field_pol_probe_obr_channel             (b_field_pol_probe_obr_channel) <U9 648B ...
  * b_field_pol_probe_obv_channel             (b_field_pol_probe_obv_channel) <U9 648B ...
  * b_field_pol_probe_omv_channel             (b_field_pol_probe_omv_channel) <U11 132B ...
  * b_field_tor_probe_cc_channel              (b_field_tor_probe_cc_channel) <U13 156B ...
    ...                                        ...
  * b_field_tor_probe_saddle_voltage_channel  (b_field_tor_probe_saddle_voltage_channel) <U15 720B ...
  * flux_loop_channel                         (flux_loop_channel) <U12 720B '...
  * time                                      (time) float64 29kB -0.0612 ......
  * time_mirnov                               (time_mirnov) float64 3MB -0.06...
  * time_omaha                                (time_omaha) float64 58MB -0.06...
  * time_saddle                               (time_saddle) float64 291kB -0....
Data variables:
    b_field_pol_probe_cc_field                (b_field_pol_probe_cc_channel, time_mirnov) float64 15MB ...
    b_field_pol_probe_ccbv_field              (b_field_pol_probe_ccbv_channel, time) float64 1MB ...
    b_field_pol_probe_obr_field               (b_field_pol_probe_obr_channel, time) float64 523kB ...
    b_field_pol_probe_obv_field               (b_field_pol_probe_obv_channel, time) float64 523kB ...
    b_field_pol_probe_omv_voltage             (b_field_pol_probe_omv_channel, time_mirnov) float64 9MB ...
    b_field_tor_probe_cc_field                (b_field_tor_probe_cc_channel, time_mirnov) float64 9MB ...
    b_field_tor_probe_omaha_voltage           (b_field_tor_probe_omaha_channel, time_omaha) float64 232MB ...
    b_field_tor_probe_saddle_field            (b_field_tor_probe_saddle_field_channel, time_saddle) float64 3MB ...
    b_field_tor_probe_saddle_voltage          (b_field_tor_probe_saddle_voltage_channel, time_saddle) float64 3MB ...
    flux_loop_flux                            (flux_loop_channel, time) float64 436kB ...
    ip                                        (time) float64 29kB -6.039e+03 ...
Attributes:
    description:
    imas:         magnetics
    label:        Plasma Current
    name:         magnetics
    uda_name:     AMC_PLASMA CURRENT
    units:        A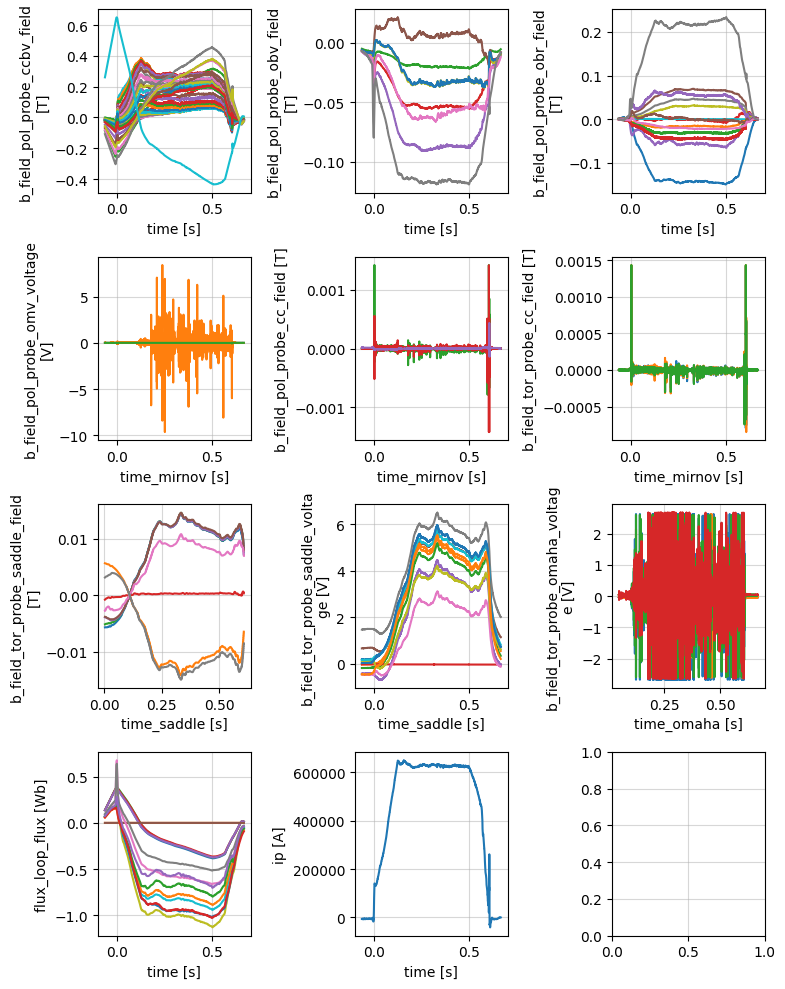
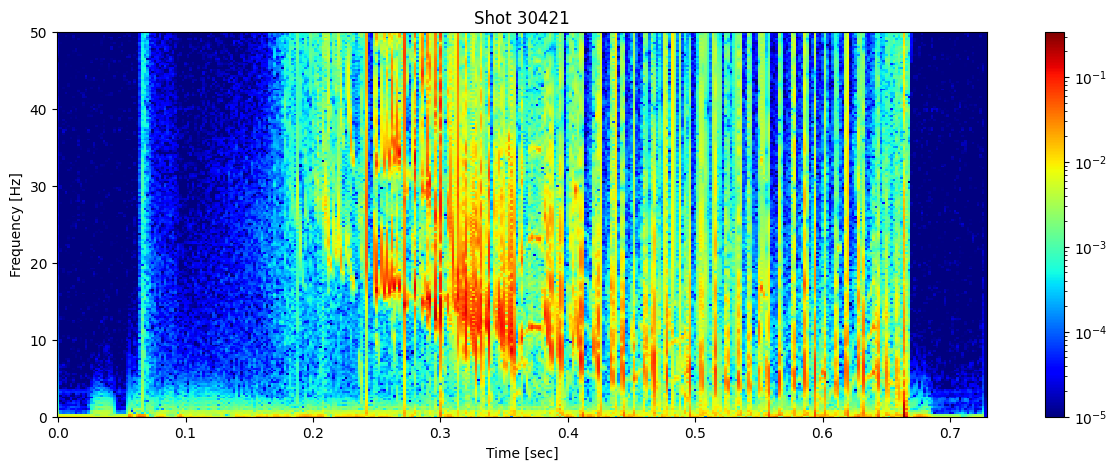
Looking at the spectrogram of one of the mirnov coils can show us information about the MHD modes. Here we see several mode instabilities occuring before the plasma is lost.
ds = profiles['b_field_pol_probe_omv_voltage'].isel(b_field_pol_probe_omv_channel=1)
# Parameters to limit the number of frequencies
nperseg = 2000  # Number of points per segment
nfft = 2000  # Number of FFT points

# Compute the Short-Time Fourier Transform (STFT)
sample_rate = 1/(ds.time_mirnov[1] - ds.time_mirnov[0])
f, t, Zxx = stft(ds, fs=int(sample_rate), nperseg=nperseg, nfft=nfft)

fig, ax = plt.subplots(figsize=(15, 5))
cax = ax.pcolormesh(t, f/1000, np.abs(Zxx), shading='nearest', cmap='jet', norm=LogNorm(vmin=1e-5))
ax.set_ylim(0, 50)
ax.set_title(f'Shot {shot_id}')
ax.set_ylabel('Frequency [Hz]')
ax.set_xlabel('Time [sec]')
plt.colorbar(cax, ax=ax)
plt.show()
Spectrometer Visible#
Spectrometer in visible light range diagnostic
profiles = xr.open_zarr(store, group='spectrometer_visible')
profiles['filter_spectrometer_dalpha_voltage'].plot.line(x='time')
profiles['filter_spectrometer_bes_voltage'].isel(bes_channel=0).plot.line(x='time_bes')
profiles
<xarray.Dataset> Size: 385MB
Dimensions:                             (time: 36321, bes_channel: 32,
                                         time_bes: 1452801, dalpha_channel: 3)
Coordinates:
  * bes_channel                         (bes_channel) <U13 2kB 'xbt/channel01...
  * dalpha_channel                      (dalpha_channel) <U13 156B 'XIM_DA/HM...
  * time                                (time) float64 291kB -0.0612 ... 0.6652
  * time_bes                            (time_bes) float64 12MB -0.0612 ... 0...
Data variables:
    density_gradient                    (time) float64 291kB ...
    filter_spectrometer_bes_voltage     (bes_channel, time_bes) float64 372MB ...
    filter_spectrometer_dalpha_voltage  (dalpha_channel, time) float64 872kB ...
Attributes:
    description:
    imas:         None
    label:        Volt
    name:         spectrometer_visible
    uda_name:     XIM_DA/HM10/R
    units:        V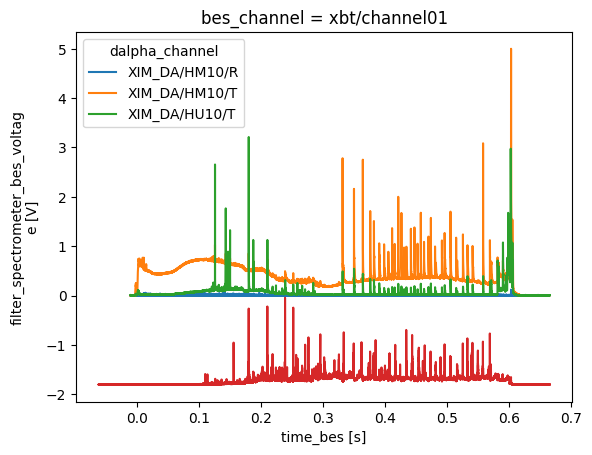
PF Active#
profiles = xr.open_zarr(store, group='pf_active')
fig, axes = plt.subplots(3, 1)
axes = axes.flatten()

profiles['coil_current'].plot.line(x='time', ax=axes[0], add_legend=False)
profiles['coil_voltage'].plot.line(x='time', ax=axes[1], add_legend=False)
profiles['solenoid_current'].plot.line(x='time', ax=axes[2], add_legend=False)

plt.tight_layout()
profiles
<xarray.Dataset> Size: 699kB
Dimensions:           (channel: 14, time: 2906)
Coordinates:
  * channel           (channel) <U21 1kB '/xdc/pf/f/p1' ... 'AMC_P5U FEED CUR...
  * time              (time) float64 23kB -0.0612 -0.06095 ... 0.6648 0.665
Data variables:
    coil_current      (channel, time) float64 325kB ...
    coil_voltage      (channel, time) float64 325kB ...
    solenoid_current  (time) float64 23kB 8.764e+03 8.813e+03 ... 773.8 780.2
Attributes:
    description:
    imas:         pf_active
    label:        Sol Current
    name:         pf_active
    uda_name:     AMC_SOL CURRENT
    units:        A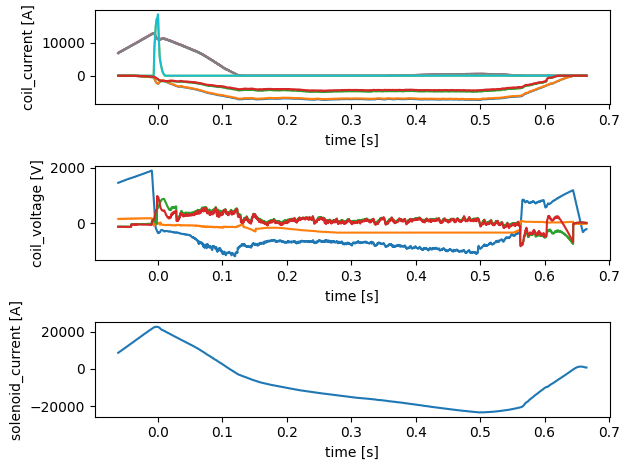
Soft X-rays#
profiles = xr.open_zarr(store, group='soft_x_rays')
fig, axes = plt.subplots(3, 1)


profiles['horizontal_cam_lower'].plot.line(x='time', ax=axes[1], add_legend=False)
axes[1].set_ylim(0, 0.02)

profiles['horizontal_cam_upper'].plot.line(x='time', ax=axes[2], add_legend=False)
axes[2].set_ylim(0, 0.02)

if "tangential_cam" in profiles:
    profiles['tangential_cam'].plot.line(x='time', ax=axes[0], add_legend=False)
    axes[0].set_ylim(0, 0.2)

plt.tight_layout()
profiles
<xarray.Dataset> Size: 160MB
Dimensions:                       (horizontal_cam_lower_channel: 18,
                                   time: 363201,
                                   horizontal_cam_upper_channel: 18,
                                   tangential_cam_channel: 18)
Coordinates:
  * horizontal_cam_lower_channel  (horizontal_cam_lower_channel) <U14 1kB '/x...
  * horizontal_cam_upper_channel  (horizontal_cam_upper_channel) <U14 1kB '/x...
  * tangential_cam_channel        (tangential_cam_channel) <U12 864B '/xsx/TC...
  * time                          (time) float64 3MB -0.0612 -0.0612 ... 0.6652
Data variables:
    horizontal_cam_lower          (horizontal_cam_lower_channel, time) float64 52MB ...
    horizontal_cam_upper          (horizontal_cam_upper_channel, time) float64 52MB ...
    tangential_cam                (tangential_cam_channel, time) float64 52MB ...
Attributes:
    description:
    imas:         None
    label:        Volt
    name:         soft_x_rays
    uda_name:     /xsx/TCAM/1
    units:        V
Thomson Profiles#
Thomson scattering measurements in a tokamak provide information about the plasma’s electron temperature and density profiles. The diagnostic analyses the scattering of laser light off free electrons in the plasma from a number of radial channels.
Below we plot the following profiles measured by the Thomson diagnostic
\(T_e\) - Electron temperature
\(N_e\) - Electron density
\(P_e\) - Electron pressure
profiles = xr.open_zarr(store, group='thomson_scattering')
profiles

fig, axes = plt.subplots(3, 1)
axes = axes.flatten()
profiles.t_e.plot(x='time', y='major_radius', ax=axes[0])
profiles.n_e.plot(x='time', y='major_radius', ax=axes[1])
profiles.p_e.plot(x='time', y='major_radius', ax=axes[2])
plt.tight_layout()

profiles
<xarray.Dataset> Size: 425kB
Dimensions:       (time: 146, major_radius: 120)
Coordinates:
  * major_radius  (major_radius) float64 960B 0.3 0.31 0.32 ... 1.47 1.48 1.49
  * time          (time) float64 1kB -0.0612 -0.0562 -0.0512 ... 0.6588 0.6638
Data variables:
    n_e           (time, major_radius) float64 140kB ...
    n_e_core      (time) float64 1kB ...
    p_e           (time, major_radius) float64 140kB ...
    t_e           (time, major_radius) float64 140kB ...
    t_e_core      (time) float64 1kB ...
Attributes:
    description:
    imas:         thomson_scattering
    label:        core temperature
    name:         thomson_scattering
    uda_name:     AYC_TE_CORE
    units:        eV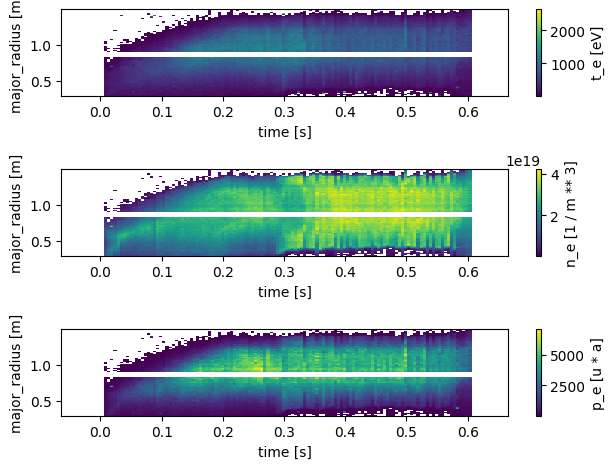
fig, axes = plt.subplots(2, 1)
profiles['t_e_core'].plot(x='time', ax=axes[0])
profiles['n_e_core'].plot(x='time', ax=axes[1])
for ax in axes:
    ax.grid('on', alpha=0.5)
plt.tight_layout()
profiles
<xarray.Dataset> Size: 425kB
Dimensions:       (time: 146, major_radius: 120)
Coordinates:
  * major_radius  (major_radius) float64 960B 0.3 0.31 0.32 ... 1.47 1.48 1.49
  * time          (time) float64 1kB -0.0612 -0.0562 -0.0512 ... 0.6588 0.6638
Data variables:
    n_e           (time, major_radius) float64 140kB ...
    n_e_core      (time) float64 1kB ...
    p_e           (time, major_radius) float64 140kB ...
    t_e           (time, major_radius) float64 140kB ...
    t_e_core      (time) float64 1kB ...
Attributes:
    description:
    imas:         thomson_scattering
    label:        core temperature
    name:         thomson_scattering
    uda_name:     AYC_TE_CORE
    units:        eV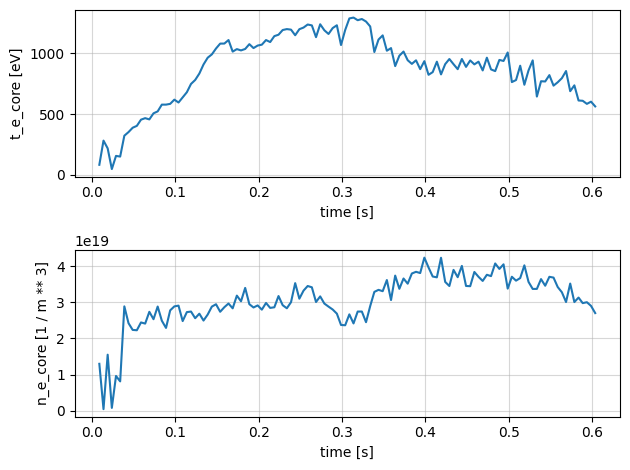
CXRS Profiles#
Charge Exchange Recombination Spectroscopy (CXRS) measurements provide information about ion temperature and plasma rotation. This diagnostic analyses the light emitted from charge exchange reactions between injected neutral beams and plasma ions.
Below we plot the following profiles measured by the CXRS diagnostic
\(T_i\) - Ion temperature
\(V_i\) - Ion velocity
profiles = xr.open_zarr(store, group='charge_exchange')

fig, axes = plt.subplots(2, 1)
profiles['t_i'].plot(x='time', y='major_radius', ax=axes[0], vmax=1000)
profiles['v_i'].plot(x='time', y='major_radius', ax=axes[1], vmax=1000)
plt.tight_layout()
profiles
<xarray.Dataset> Size: 376kB
Dimensions:       (time: 146, major_radius: 160)
Coordinates:
  * major_radius  (major_radius) float64 1kB 0.0 0.01 0.02 ... 1.57 1.58 1.59
  * time          (time) float64 1kB -0.0612 -0.0562 -0.0512 ... 0.6588 0.6638
Data variables:
    t_i           (time, major_radius) float64 187kB ...
    v_i           (time, major_radius) float64 187kB ...
Attributes:
    description:
    imas:         charge_exchange
    label:        Carbon temperature
    name:         charge_exchange
    uda_name:     ACT_SS_TEMPERATURE
    units:        eV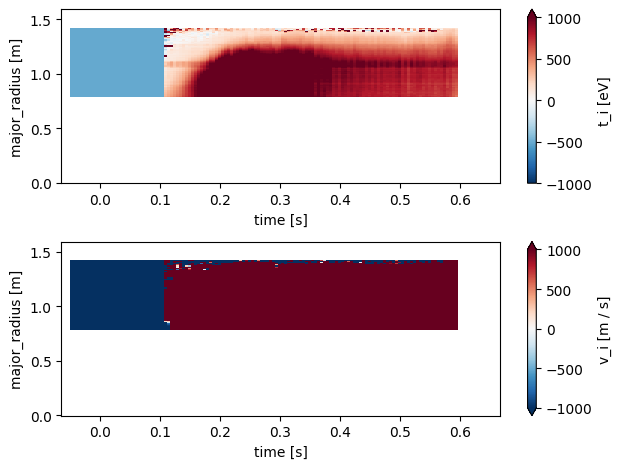
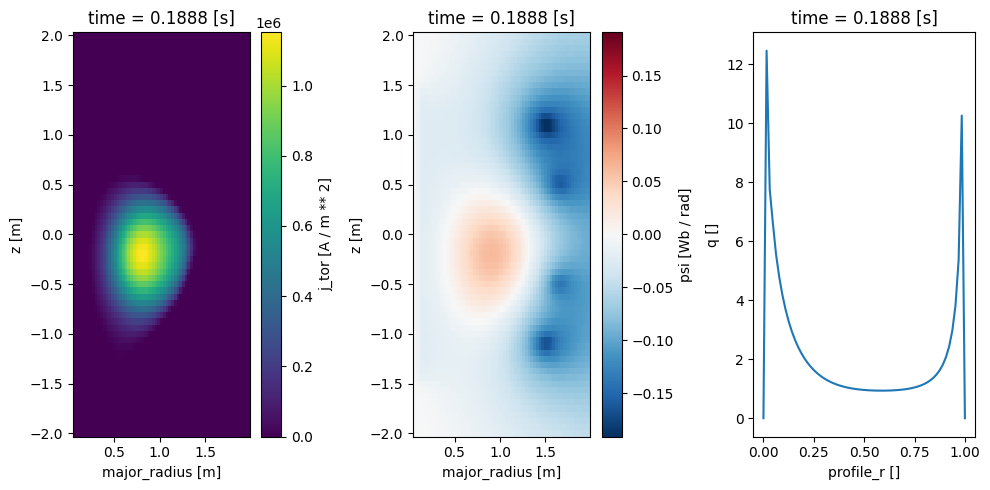
Equilibrium#
profiles = xr.open_zarr(store, group='equilibrium')

profile_1d = profiles.drop_vars(['j_tor', 'psi', 'q'])
plot_1d_profiles(profile_1d)

profiles
<xarray.Dataset> Size: 10MB
Dimensions:              (time: 146, z: 65, major_radius: 65,
                          n_boundary_coords: 139, profile_r: 65, n_x_points: 4)
Coordinates:
  * major_radius         (major_radius) float64 520B 0.06 0.09 ... 1.95 1.98
  * n_boundary_coords    (n_boundary_coords) float32 556B 0.0 1.0 ... 138.0
  * n_x_points           (n_x_points) <U16 256B 'EFM_XPOINT1_R(C)' ... 'EFM_X...
  * profile_r            (profile_r) float32 260B 0.0 0.01562 ... 0.9844 1.0
  * time                 (time) float64 1kB -0.0612 -0.0562 ... 0.6588 0.6638
  * z                    (z) float32 260B -2.0 -1.938 -1.875 ... 1.875 1.938 2.0
Data variables: (12/35)
    beta_normal          (time) float64 1kB ...
    beta_pol             (time) float64 1kB ...
    beta_tor             (time) float64 1kB ...
    bphi_rmag            (time) float64 1kB ...
    bvac_rmag            (time) float64 1kB ...
    da_rating            (time) float64 1kB ...
    ...                   ...
    triangularity_upper  (time) float64 1kB ...
    vloop_dynamic        (time) float64 1kB ...
    vloop_static         (time) float64 1kB ...
    whmd                 (time) float64 1kB ...
    x_point_r            (n_x_points, time) float64 5kB ...
    x_point_z            (n_x_points, time) float64 5kB ...
Attributes:
    description:
    imas:         equilibrium
    label:        q(r) at z=0.
    name:         equilibrium
    uda_name:     EFM_Q(R)
units: 
fig, axes = plt.subplots(1, 3, figsize=(10, 5))

profiles['j_tor'].isel(time=50).plot(ax=axes[0], x='major_radius')
profiles['psi'].isel(time=50).plot(ax=axes[1], x='major_radius')
profiles['q'].isel(time=50).plot(ax=axes[2])
plt.tight_layout()
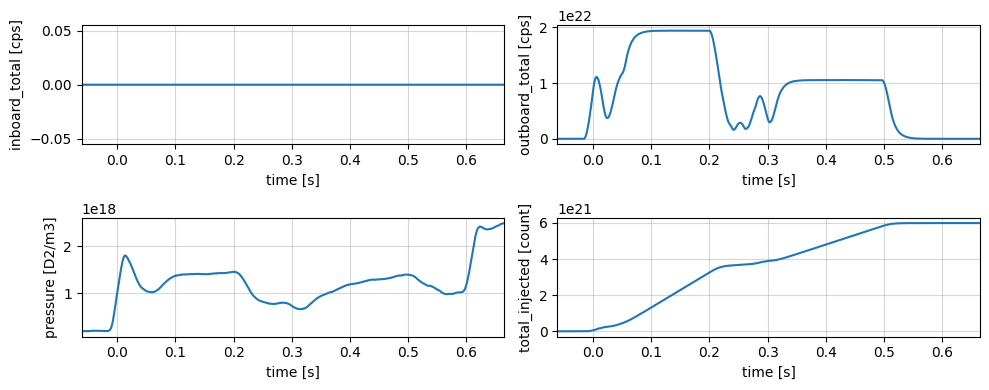
Gas Injection#
profiles = xr.open_zarr(store, group='gas_injection')

plot_1d_profiles(profiles)
plt.tight_layout()
profiles
<xarray.Dataset> Size: 116kB
Dimensions:         (time: 2906)
Coordinates:
  * time            (time) float64 23kB -0.0612 -0.06095 ... 0.6648 0.665
Data variables:
    inboard_total   (time) float64 23kB ...
    outboard_total  (time) float64 23kB ...
    pressure        (time) float64 23kB ...
    total_injected  (time) float64 23kB ...
Attributes:
    description:
    imas:         gas_injection
    label:        Integrated total gas
    name:         gas_injection
    uda_name:     AGA_INTEG_GAS
    units:        count